Zumwalt out as Royals hitting coach
Alec Zumwalt is reassigned within the organization. Plus, Carter Jensen is named AL Player of the Month for September.
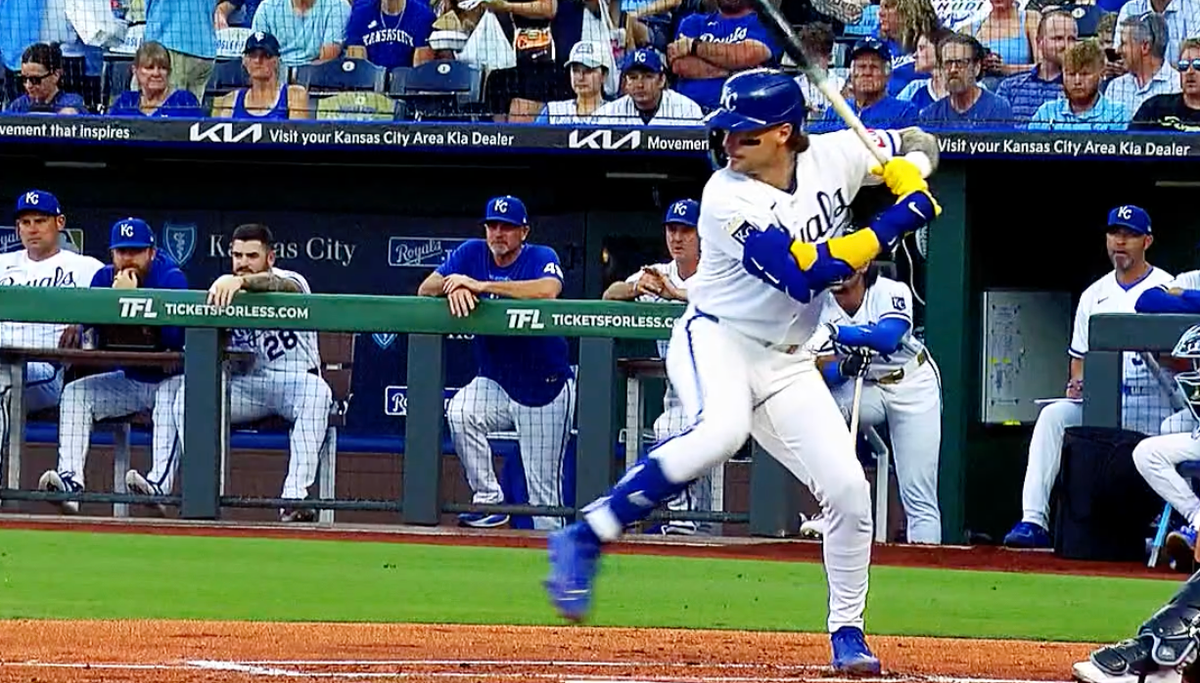
The Royals press conference to wrap the 2026 season is later on Wednesday. That didn't prevent news about the on-field staff from coming out on Tuesday. Ken Rosenthal at The Athletic had the scoop: The Royals were removing hitting coach Alec Zumwalt from the dugout.
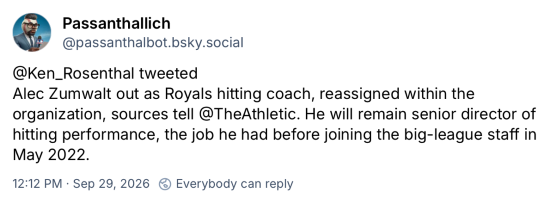
Zumwalt just completed his 15th season with the Royals. He has been the Senior Director of Hitting Performance since 2021. He added hitting coach to his duties on May 16, 2022, replacing Terry Bradshaw.
Zumwalt came under quite a bit of fire as the offense seemed to regress across the board in 2025 and the Royals faded from the playoff race. The cracks started to show in September of 2024. The fire didn't abate in the early going in 2026 as an underperforming offense in the first two months of the season was part of the Royals three ring circus of baseballing frustrations.
Despite the early struggles, the Royals offense ran surprisingly close to league average for most of the 2026 season. They had a good April where they collectively hit .240/.322/.389 which was exactly in line with league average production. The nadir was the following month. In May the Royals hit .228/.294/.356, which was an 82 OPS+. That was abysmal. But they recovered and posted well the rest of the year. From Baseball Reference, we can see the Royals offense was fairly steady once they got past May:
| Split | PA | AB | R | H | 2B | 3B | HR | RBI | BB | SO | BA | OBP | SLG | OPS | tOPS+ |
|---|---|---|---|---|---|---|---|---|---|---|---|---|---|---|---|
| April/March | 1170 | 1024 | 126 | 246 | 49 | 5 | 31 | 119 | 115 | 258 | .240 | .322 | .389 | .711 | 99 |
| May | 1028 | 921 | 95 | 210 | 50 | 1 | 22 | 95 | 83 | 215 | .228 | .294 | .356 | .650 | 82 |
| June | 1043 | 937 | 140 | 247 | 53 | 4 | 32 | 129 | 85 | 211 | .264 | .328 | .431 | .759 | 111 |
| July | 933 | 850 | 99 | 212 | 49 | 3 | 27 | 94 | 64 | 208 | .249 | .307 | .409 | .717 | 99 |
| August | 1008 | 900 | 130 | 233 | 48 | 5 | 29 | 124 | 87 | 193 | .259 | .327 | .420 | .747 | 108 |
| Sept/Oct | 901 | 806 | 100 | 197 | 44 | 1 | 29 | 95 | 78 | 187 | .244 | .317 | .409 | .726 | 102 |
Individually, Jac Caglianone really broke out this summer. He was the AL Player of the Month for August. Carter Jensen had an amazing season, building off his impressive cup of coffee from 2025. That culminated with an AL Player of the Month award for September. (More on that in a moment.) If you’re going to put the hitting coach on blast for underperforming players, you have to dole out some credit when the cornerstones of your organization flourish.
This is a results-based business. On offense, the results could be measured by the amount of runs scored. Here's how the Royals have done over the last five seasons in runs scored per game, along with their rank in the majors.
2026 - 4.26 R/G (22nd)
2025 - 4.02 R/G (26th)
2024 - 4.54 R/G (13th)
2023 - 4.17 R/G (23rd)
2022 - 3.95 R/G (24th)
The 2024 season looks like an extreme outlier but 2026 feels like a step forward. Since overall league offensive production varies from season to season, a full table from FanGraphs helps show how the Royals have done in regards to the league.
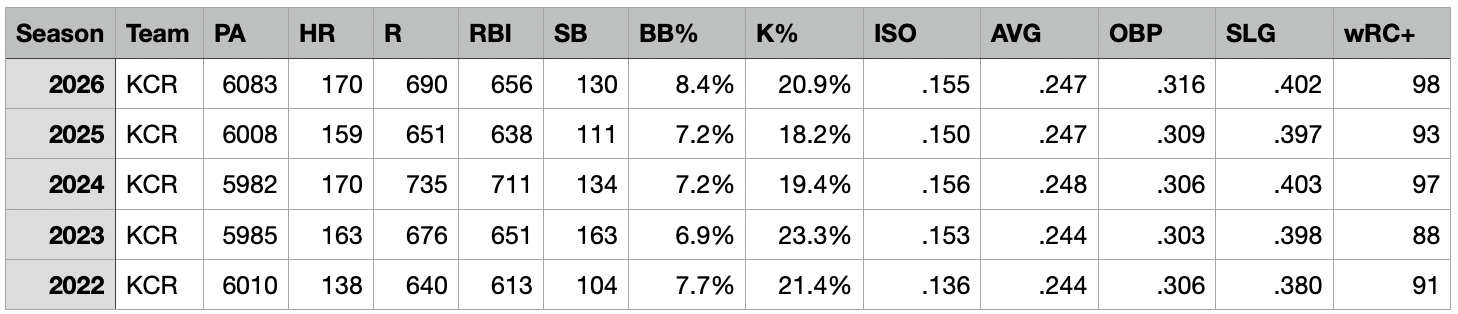
A reminder that wRC+ is Weighted Runs Created which is kind of a catch-all of offensive performance relative to the league. The league average is always 100. A number above 100 is above league average. Below 100 is below league average. In the Zumwalt hitting coach era, the Royals have run consistently below league average with their strongest years being 2024 and 2026.
Look at the raw numbers in the table above. The Royals posted their best walk rate, tied for the most home runs, posted their best OBP and fell just a single point off their high mark for slugging percentage in 2026. Most hitters showed marked improvement after the All-Star Break. Maybe that was the adjustment period fellow hitting coaches Marcus Thames and Connor Dawson, both brought on board prior to the season, needed to begin to make an impact.
Zumwalt remains Senior Director of Hitting Performance so I assume the organization hitting philosophy continues to start with him and filters down to the dugout. He will certainly be less hands-on than previously, which could be a good thing. I don't know. Also, how will the Royals ride with their hitting coaches now? Will Dawson or Thames get the bump to the lead hitting coach or will they continue in tandem? They seemed to have developed a strong working relationship with the players. The results in the last four months of the season certainly suggest some progress.
What I believe this move signals is that the Royals feel there's more to come from their offensive performance. I can't disagree there, but the club would be better served to finding two or three productive bats from outside the org. The Picollo Era has been marked by awarding too many plate appearances to too many sub-mediocre hitters.
Zumwalt has been in the sights for a segment of this fan base for the better part of two seasons. I get it. When a team underperforms—and the Royals have certainly underperformed—there needs to be accountability. Owner John Sherman's guy is Picollo. Picollo's guy is Quatraro. So someone on the coaching staff needs to take the fall. Or be reassigned.
For myself, I'm fine with this move. It needed to be made simply because the offensive valleys have been too low for too long and the peaks aren't high enough. A new voice is needed. Or the current voices—other than Zumwalt—need to be amplified. Bringing Thames and Dawson on board were solid moves. This is an opportunity to maximize the returns.
It's too bad this news broke about 24 hours before Picollo and Quatraro were scheduled to meet the media because that means we're spending a full day just speculating as to what it all means. I imagine this will be topic number one on Wednesday.
There will most certainly be more to come.

As noted earlier, MLB announced their monthly honors on Tuesday with Carter Jensen bringing home a couple of pieces of hardware. Jensen bagged the AL Player of the Month award and was also named the AL Rookie of the Month. Nice haul.
Jensen’s September was dreamy. In 21 games covering 80 PAs, he hit .338/.407/.787 with 10 doubles, eight homers and 20 RBI. Those 10 doubles were the most in the majors in September. He also led the league in extra-base hits (he tossed in one triple for good measure), slugging percentage and OPS.
I think for all of us, the most impressive part of Jensen’s month was his streak where 12 straight hits went for extra bases. That’s now a major league record for a rookie, previously held by Aaron Judge.
Just for fun—and a little perspective—I visited Stathead to find the best months in Royals history as ranked by OPS. Here are the top 15:
| Rk | I | Player | Split | Year | OPS | PA | AB | R | H | 2B | 3B | HR | RBI | BA | OBP | SLG | TB | sOPS+ |
|---|---|---|---|---|---|---|---|---|---|---|---|---|---|---|---|---|---|---|
| 1 | George Brett | April/March | 1983 | 1.448 | 72 | 63 | 18 | 29 | 12 | 1 | 5 | 20 | .460 | .528 | .921 | 58 | 304 | |
| 2 | John Mayberry | June | 1972 | 1.365 | 76 | 68 | 13 | 32 | 7 | 0 | 6 | 30 | .471 | .526 | .838 | 57 | 299 | |
| 3 | George Brett | July | 1980 | 1.353 | 98 | 85 | 18 | 42 | 12 | 3 | 3 | 25 | .494 | .541 | .812 | 69 | 273 | |
| 4 | Bobby Witt Jr. | July | 2024 | 1.353 | 100 | 90 | 26 | 44 | 8 | 1 | 7 | 22 | .489 | .520 | .833 | 75 | 264 | |
| 5 | Jermaine Dye | April/March | 2000 | 1.306 | 111 | 98 | 22 | 38 | 12 | 0 | 11 | 28 | .388 | .459 | .847 | 83 | 221 | |
| 6 | Danny Tartabull | July | 1991 | 1.287 | 94 | 74 | 20 | 28 | 7 | 0 | 8 | 19 | .378 | .489 | .797 | 59 | 250 | |
| 7 | George Brett | July | 1985 | 1.261 | 116 | 95 | 23 | 41 | 5 | 1 | 7 | 24 | .432 | .534 | .726 | 69 | 248 | |
| 8 | John Mayberry | July | 1975 | 1.256 | 125 | 104 | 23 | 38 | 8 | 0 | 12 | 32 | .365 | .468 | .788 | 82 | 250 | |
| 9 | Mike Sweeney | June | 2001 | 1.243 | 110 | 97 | 22 | 38 | 6 | 0 | 11 | 29 | .392 | .450 | .794 | 77 | 214 | |
| 10 | Danny Tartabull | Sept/Oct | 1987 | 1.231 | 135 | 115 | 26 | 44 | 8 | 1 | 11 | 28 | .383 | .474 | .757 | 87 | 235 | |
| 11 | Jeff King | June | 1997 | 1.209 | 109 | 93 | 24 | 33 | 7 | 1 | 10 | 29 | .355 | .435 | .774 | 72 | 208 | |
| 12 | Salvador Perez | Sept/Oct | 2020 | 1.197 | 64 | 62 | 12 | 23 | 6 | 0 | 7 | 20 | .371 | .391 | .806 | 50 | 216 | |
| 13 | Carter Jensen | Sept/Oct | 2026 | 1.194 | 91 | 80 | 19 | 27 | 10 | 1 | 8 | 20 | .338 | .407 | .788 | 63 | 223 | |
| 14 | Amos Otis | Sept/Oct | 1978 | 1.177 | 125 | 107 | 19 | 44 | 7 | 3 | 6 | 29 | .411 | .476 | .701 | 75 | 239 | |
| 15 | Willie Aikens | Sept/Oct | 1982 | 1.173 | 86 | 75 | 14 | 28 | 2 | 0 | 8 | 22 | .373 | .453 | .720 | 54 | 226 |
There are some franchise icons on that list. Impressive.
What left me kind of shocked was the note from the Royals PR team that Jensen was the first primary catcher in club history to win an AL Player of the Month award. I figure most of you will think immediately about Salvador Perez, but us elder statesmen would pivot to Darrell Porter, who had an outstanding season behind the plate for the Royals in 1979.
For fun, I took the query from Stathead above and filtered to highlight the catchers. Normally, I'd do top 10 because that's what you do. I decided to expand the list by one to help highlight the insane '79 season Porter had.
| Rk | I | Player | Split | Year | OPS | PA | AB | R | H | 2B | 3B | HR | RBI | BA | OBP | SLG | TB | sOPS+ |
|---|---|---|---|---|---|---|---|---|---|---|---|---|---|---|---|---|---|---|
| 1 | Salvador Perez | Sept/Oct | 2020 | 1.197 | 64 | 62 | 12 | 23 | 6 | 0 | 7 | 20 | .371 | .391 | .806 | 50 | 216 | |
| 2 | Carter Jensen | Sept/Oct | 2026 | 1.194 | 91 | 80 | 19 | 27 | 10 | 1 | 8 | 20 | .338 | .407 | .788 | 63 | 223 | |
| 3 | Gregg Zaun | Sept/Oct | 2001 | 1.156 | 57 | 50 | 8 | 19 | 4 | 0 | 4 | 7 | .380 | .456 | .700 | 35 | 205 | |
| 4 | Gregg Zaun | Sept/Oct | 2000 | 1.144 | 53 | 39 | 9 | 15 | 3 | 0 | 2 | 5 | .385 | .528 | .615 | 24 | 202 | |
| 5 | Mike Macfarlane | May | 1993 | 1.127 | 74 | 65 | 11 | 22 | 6 | 0 | 6 | 20 | .338 | .419 | .708 | 46 | 205 | |
| 6 | John Buck | April/March | 2007 | 1.106 | 61 | 50 | 8 | 16 | 6 | 0 | 4 | 7 | .320 | .426 | .680 | 34 | 198 | |
| 7 | Salvador Perez | July | 2025 | 1.098 | 96 | 89 | 14 | 30 | 7 | 0 | 9 | 21 | .337 | .379 | .719 | 64 | 194 | |
| 8 | Jamie Quirk | August | 1988 | 1.096 | 55 | 42 | 6 | 14 | 4 | 0 | 3 | 12 | .333 | .453 | .643 | 27 | 214 | |
| 9 | Mike Macfarlane | June | 1996 | 1.052 | 72 | 65 | 11 | 21 | 6 | 1 | 5 | 10 | .323 | .375 | .677 | 44 | 164 | |
| 10 | Darrell Porter | April/March | 1979 | 1.047 | 89 | 71 | 17 | 26 | 4 | 2 | 2 | 19 | .366 | .483 | .563 | 40 | 189 | |
| 11 | Darrell Porter | August | 1979 | 1.046 | 117 | 92 | 22 | 29 | 5 | 3 | 5 | 23 | .315 | .448 | .598 | 55 | 185 |
Gotta say I did not expect to see Gregg Zaun on the list. Twice!
But look at Jensen at the second-best month for a catcher in franchise history sorted by OPS. And it's the top OPS+, meaning, like wRC+ it's adjusted for league performance. He's not going to win the Rookie of the Year award, but that shouldn't diminish the impressive season he just completed. The kid is a dude.
Comments ()